
Hype vs. Fundamentals in AI Infrastructure: Unbounded Demand, Unknown Returns
Capital is flowing into AI infrastructure faster than anyone can measure what it will earn. Five hyperscalers issued $121 billion of bonds in 2025, against an average of $28 billion a year from 2020 to 2024 (Fortune). Morgan Stanley estimates 2026 hyperscaler capital spending near $800 billion (Morgan Stanley). The Wall Street Journal counts roughly $3 trillion in further purchase and lease commitments across nine of the largest AI builders that sit outside their balance sheets (WSJ).
The demand behind that spending has no visible ceiling. Every AI-enabled device sends more data than the device it replaced. Ericsson's June 2026 Mobility Report projects AI-driven uplink traffic reaching three times its 2025 level by 2031.
That compute supply faces hard limits. Power availability, grid interconnection, and construction timelines set the pace at which capacity comes online, whatever the financing. Sightline Climate projects that 30 to 50% of the announced data center pipeline will be delayed or cancelled. (Tech Insider)
The investment playbook that built the tech industry no longer applies. A software company was asset light, raised a few rounds, shipped a product, and watched its marginal cost fall toward zero as users grew. Margins widened with scale, and the mature company became a cash machine. AI is asset heavy and operational costs move with demand as every query consumes compute. With our current technology, capital requirements keep climbing and do not taper into a harvest phase.
DePIN networks that sell connectivity, positioning, and sensing data sit on the demand side of this question. Demand for their services follows usage, which grows with every connected device and vehicle. That holds whether the financing behind data center capacity resolves well or badly. How much of that usage reaches token holders depends on each network's design, a question GridEcon on examined for Helium, GEODNET, NATIX, Hivemapper, and DIMO in DePIN meets the AI Demand Curve.
How Much Capital Is Waiting on the Answer
Bond markets carry a large and visible portion of the financing. J.P. Morgan Asset Management counts $194 billion of gross hyperscaler bond issuance in the first half of 2026 alone (JP Morgan). Morgan Stanley forecasts total AI-linked global debt issuance near $570 billion for the full year (Reuters). These numbers only tell part of the story.
A second layer is off-balance-sheet project finance executed through special purpose vehicles. Private credit funds, principally Blackstone, Blue Owl Capital, Apollo, PIMCO, and BlackRock, originate the majority of data center debt through SPV structures and direct lending facilities. Tech firms' share of outstanding private credit lending rose from 22% in 2010 to nearly 45% by 2025, on a market that grew to almost $2.5 trillion, with AI-specific lending among the fastest-growing categories within that shift (BIS). A hyperscaler that builds a data center through an SPV, leases it back, and keeps the obligation off its balance sheet does not show that liability in its reported leverage ratio.
Credit markets have begun to price this exposure apart from the rest of the market. Credit spreads overall stayed near the lower end of their historical range through the summer. Over the BIS's June to early September review period, price-to-earnings ratios fell nearly 15% for hyperscalers and 40% for semiconductor manufacturers. Credit default swap spreads rose for both groups, while spreads for the rest of the S&P 500 held steady. The BIS attributes the credit move to investors demanding greater compensation as hyperscaler debt issuance booms. (BIS)
A Wall Street Journal analysis of securities filing footnotes sizes a third layer that sits outside the balance sheet. Nine major technology and chip companies carry roughly $1.9 trillion in purchase commitments for chips and equipment. They also carry roughly $1.2 trillion in leases that are signed but not yet commenced, up nearly fourfold from a year earlier. Together these commitments run about three times what the same companies report in recognized leases and long-term debt (WSJ). A lease reaches the balance sheet only when it commences. Reported leverage ratios therefore trail the commitments already made.
The markets are already starting to price in this uncertainty, in late July 2026, an AI stock selloff pushed Wall Street banks to demand more collateral from hedge funds carrying concentrated AI exposure. Goldman Sachs noted that gross leverage had climbed over the prior five months at the fastest pace it had tracked since 2016. The Nasdaq 100 briefly slipped into correction territory on July 28, down 10% from its early June high, and long-short and multi-strategy hedge funds posted their worst simultaneous single-day loss since 2020. (Financial Times)
The Ownership Stack Behind the Buildout
The debt repayment behind AI data centers is funded by the companies that rent the capacity. Two financing structures carry that risk to lenders. In the first, an operator such as CoreWeave rents capacity to companies such as Microsoft, OpenAI, and Meta. In the second, a hyperscaler rents directly from a dedicated vehicle that holds the debt. The structures differ in who stands between the lender and the tenant.
CoreWeave rents its buildings and sells the capacity on take-or-pay contracts that average about five years. The customer base is concentrated. Microsoft supplied about 67% of 2025 revenue. OpenAI committed up to about $6.5 billion through May 2031, and Meta initially committed up to about $14.2 billion through December 2031. A lender to CoreWeave depends on CoreWeave collecting from these customers. (CoreWeave 10-K)
The second structure removes the operator. A dedicated vehicle owns the data center, and consortium sponsors fund it with equity. The hyperscaler holds a minority stake and signs long-term leases or capacity offtake agreements. Private credit funds and other institutional investors hold the debt, and the lease payments service it (BIS, March 2026). Some of that debt carries investment grade features, backed by the assets and by guarantees from investment grade hyperscalers.
Behind every one of these tenants sits the same source of repayment. Someone pays Microsoft, OpenAI, or Meta for an AI product or service. That revenue funds the lease, and the lease services the debt. Whether the revenue arrives at the scale the leases assume is the unanswered question.
Returns are an Open Question
In the typical software playbook, the product was highly scalable. Capital was spent early in the company lifecycle using a few funding rounds to build the product. Then once the product matured the marginal operating cost of serving the next customer trended towards zero.
AI inference is an asset intensive service and it removes the near-zero marginal cost step. Every query consumes compute, so every new customer carries a real cost to serve. The capital requirement keeps growing with usage.
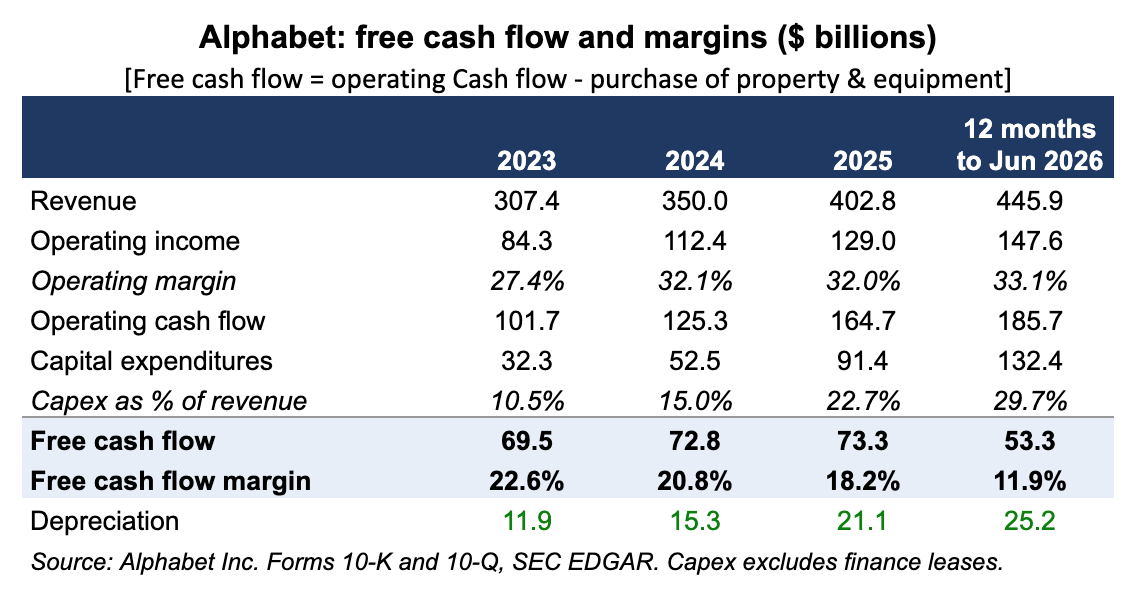
Alphabet's income statement and its cash flow statement show us how this is playing out firsthand. While operating margins have risen since 2023, from 27.4% to 33.1%, while free cash flow held flat in dollars through 2025 against rising revenue. In June 2026, trailing 12 months free cash flow dropped sharply and its current share of revenue nearly halved to approximately 12%. Alphabet may be on track to doubling its capex in 2026 vs. 2025. If Gemini's services earn margins similar to Alphabet's existing products, operating margin holds. If they earn less, operating margin compresses. The below chart illustrates Alphabet’s free cash flow compared to revenues.
The Physical Limits on Supply
Capital can be raised in months. A grid connection takes years. AI infrastructure is financed at the speed of capital markets and built at the speed of electrical equipment, so the two clocks run apart.
The scale of the electricity demand is large. The International Energy Agency puts global data center consumption at about 415 terawatt-hours in 2024, or 1.5% of world electricity. It expects that figure to more than double to about 945 terawatt-hours by 2030. Data centers account for nearly half of US demand growth over that period (IEA, Energy and AI). The US Department of Energy reports that data centers used about 4.4% of US electricity in 2023. The Lawrence Berkeley National Laboratory projects 6.7% to 12% by 2028 (DOE).
The equipment that delivers this power is scarce. Wait times for transformers and cables have doubled in three years. Gas turbine orders now carry lead times of several years. New transmission lines take four to eight years to build in advanced economies. The IEA estimates that around 20% of planned data center projects are at risk of delay. (IEA, Energy and AI)
Announced projects convert to energized capacity slowly. Sightline Climate counts at least 16 gigawatts across roughly 140 projects scheduled to come online in 2026. About 5 gigawatts is under construction, and about 11 gigawatts is still at the announcement stage with no visible construction. Sightline projects that 30% to 50% of 2026 capacity will be delayed. In 2025, 26% of expected capacity slipped (Sightline Climate, February 2026).
Three Checks for Usage Driven Protocols
The sections above describe the supply of AI infrastructure. DePIN networks that sell usage-driven data and connectivity sit on the other side of that market. They earn when AI-enabled devices send traffic, request positioning, and capture imagery. That revenue follows use, and use grows whichever way the financing and infrastructure resolve.
Our earlier piece, DePIN meets the AI Demand Curve, traced this through Helium, GEODNET, NATIX, Hivemapper, and DIMO. It found demand rising across connectivity, positioning, and visual data, with each network's token design deciding how much of that demand reaches holders. Ericsson's June 2026 Mobility Report, for example, projects AI-driven uplink traffic reaching three times 2025 levels by 2031.
Three checks follow for protocols in this category. Protocols that sell connectivity or positioning per unit should test whether volume grows faster than the price per unit falls. Protocols that sell training data should identify whose budget pays for it, because a buyer funded by AI capital markets carries the financing question above into the protocol's revenue. Protocols running burn mechanisms should measure how much of each dollar of revenue reaches permanent supply removal before treating usage growth as token demand.
Disclaimer
This piece is for informational and educational purposes only. It does not constitute investment, financial, legal, or trading advice. Nothing in it is a recommendation to buy, sell, or hold any security or digital asset, including the securities of any company named. Projections cited reflect the assumptions of their sources, and actual outcomes may differ materially. Figures are drawn from the cited sources and reflect the data available as of October 2026.
Conflicts of Interest
GridEcon previously advised a commercial Helium deployer on tokenomics and business strategy. That engagement has ended. GridEcon holds no current compensation, token allocation, or advisory relationship with any entity named in this piece.
